1.2.3What happens in the middle?
Holes, Vertical Asymptotes, and Approach Statements
For
Draw a careful sketch of each function. Use a dashed line for an asymptote and an open circle for a “hole” (a single point which the graph appears to go through, but where it is actually undefined).
For both
and , write the equations of all asymptotes and the coordinates of any holes. State the domains and ranges of
and .
HOLES AND ASYMPTOTES
With your team, write a conjecture that states which rational functions of the form
Possible rational expressions:
MORE ON RATIONAL FUNCTIONS
Do the functions
and have the same graph? Does ? Why or why not? The expressions
and are not quite equivalent. Add a statement to to make it true. From now on, domain restrictions will be important. Rewrite
and include any necessary domain restrictions.

Approach Statements
A statement that describes the behavior of a function at various locations is called an approach statement. Although you can use shorthand symbols, such as “
A complete set of approach statements includes the extremes of the domain, as well as any holes or asymptotes. Below is a complete set of approach statements for
As
As

As
As
.png)
As
As
.png)
As
As
.png)
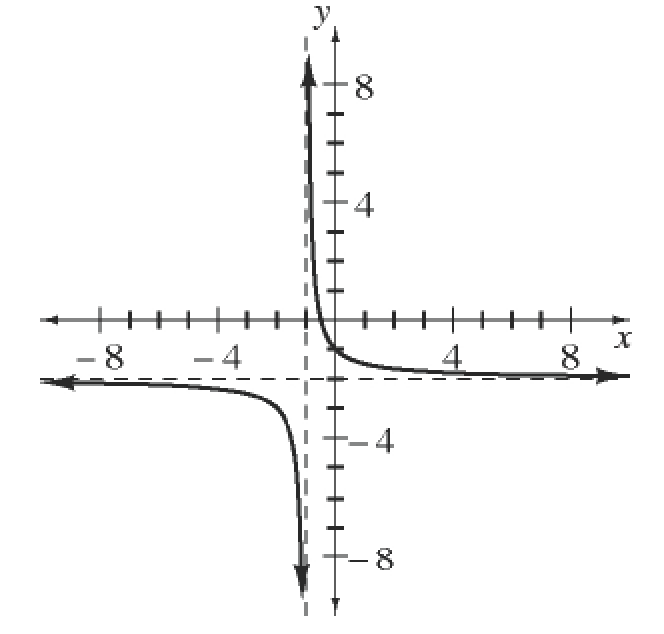
Examine the graph of
What does
approach as ? What does
approach as ? What does
approach as (the symbol “ ” means approaching from the negative direction, or from the left)? What does
approach as (from the positive direction, or from the right)? Name all horizontal and vertical asymptotes.
Sketch a graph of an even function that has a vertical asymptote at
In problem 1-46, the numerator and denominator were both polynomials. When this is not the case, factoring is no longer useful. For each function in parts (a) through (f):
If the function is defined at
, state the value at . If the function is not defined at
, use your calculator to sketch a graph. Clearly indicate whether the function has a hole or an asymptote at .
For the following functions, when
Sketch a graph and write the equation of a function that looks like
with a hole at .

Analyze the graph of
What does
approach as ? What does approach as ? Describe how your answer can be predicted from the given equation. What does
approach as ( from the left)? What does approach as ( from the right)? Describe how your answer can be predicted from the given equation.
.png)
Write the equation of a function that has the following complete set of approach statements. Hint: Start by sketching the graph. 1-52 HW eTool. Homework Help ✎
As
As
As
As
Convert the following domain and range from interval notation to set notation. Then sketch a possible function with the given domain and range. Homework Help ✎
On graph paper, sketch the function
Use geometry to calculate this area. Hint: Draw in a radius to create two easier regions whose difference is the shaded region.
Calculate the area under the curve for
. Calculate the area under the curve for
.
A marathon runner runs a
How long does it take her to finish the race?
What is her average velocity? Explain your reasoning.
Suppose she runs at a constant pace of
miles/hour. How far will she have gone in hours? Show how the units in your answer to part (c) reduce using
.
Wei Kit loves patterns! When making calculations with rational exponents, he looks for a way to avoid using his calculator. For example, he knows that
Use Wei Kit’s method to evaluate the following expressions: Homework Help ✎
Sketch a graph of
As
approaches? As
, approaches? As
( from the left), approaches?
If for
Using six left endpoint rectangles. The first two rectangles are drawn for you.
Using six right endpoint rectangles.
Using six trapezoids. What do you notice? Does this always happen?
.png)
Each of the continuous functions in the table below is increasing, but each increases differently. Match each graph below with the function that grows in a similar fashion in the table. 1-59 HW eTool Homework Help ✎

.png)
.png)
When the semi-circular flag below is rotated, it has a volume of
Describe the resulting three-dimensional figure.
What is the value of
? If the diagram is rotated
and the flag is then rotated about a horizontal pole, will the volume change?
.png)